For Retail Investors
Retail memberships are intended for individual use only. If your use case involves advising clients or other redistribution or republication of our models, please contact us to learn about other options.
Free Newsletter
$0/yr
Early Access Newsletter: Monthly email update of select model ratings - sent out mid-month, about two weeks before public website updates.
Premium
Weekly Updates: Every CMV model updated weekly*
Enhanced Charts: Every chart on each model page becomes interactive, showing additional detail and zoom/scan capability
Market Model: Access to the CMV Aggregate Market Value Index, a weekly index score of overall stock market valuation
details below
Correlation: View detailed charts and metrics on how each valuation model correlates with market performance across different time horizons
If you don't love it, cancel with one click and you'll never be charged.
Data Download
$199/yr
Weekly Updates: Every CMV model updated weekly*
Enhanced Charts: Every chart on each model page becomes interactive, showing additional detail and zoom/scan capability
Market Model: Access to the CMV Aggregate Market Value Index, a weekly index score of overall stock market valuation
details below
Correlation: View detailed charts and metrics on how each valuation model correlates with market performance across different time horizons
Downloads: Download up to 70 years historical data for select models (see detail here) in clean .xls format
-
Use to better understand market cycles, or to inform your own market models
Note however that refunds are not available on digital download products, including the "Data Download" membership. Prior to purchase, please review the provided dummy data to ensure you're satisfied with the format and detail of the data product prior to purchase.
Model Update Timing
The update frequency for all models is shown below. Generally speaking, the public facing (non-member) website is updated 1.5 months after each quarter end. Members receive weekly data updates, as the data for each model becomes available (*exceptions noted below).
Current status for each model shown below.
Members |
Non-Members |
|||||
|---|---|---|---|---|---|---|
| Model | Currently Showing | Update Frequency | Next Update | Currently Showing | Update Frequency | Next Update |
| Buffett Indicator | Jul 24 | Weekly | Aug 01 | Mar 31 | Quarterly | On Aug 15, with Jul 01 data |
| P/E Ratio | Jul 24 | Weekly | Aug 01 | Mar 31 | ||
| Interest Rates | Jul 24 | Weekly | Aug 01 | Mar 31 | ||
| Mean Reversion | Jul 24 | Weekly | Aug 01 | Mar 31 | ||
| Earnings Yield Gap | Jul 24 | Weekly | Aug 01 | Mar 31 | ||
| Yield Curve | Jul 24 | Weekly | Aug 01 | Mar 31 | ||
| Sahm Rule | Jun 30 | Monthly | Aug 08 | Mar 31 | ||
| State Coincidence | May 31 | Monthly | Jul 25 | Dec 31 | ||
| Margin Debt | May 31 | Monthly | Aug 22 | Feb 28 | ||
| Junk Bond Spreads | Jul 24 | Weekly | Aug 01 | Mar 31 | ||
| VIX Fear Index | Jul 24 | Weekly | Aug 01 | Mar 31 | ||
Premium Membership
Aggregate Market Valuation Index
Premium membership includes access to the CMV Aggregate Market Valuation Index (AMVI) model, our aggregate score of the current valuation of the US stock market. This is presented as a combined score showing approximately how many standard deviations the market is from historic norm, per our models.
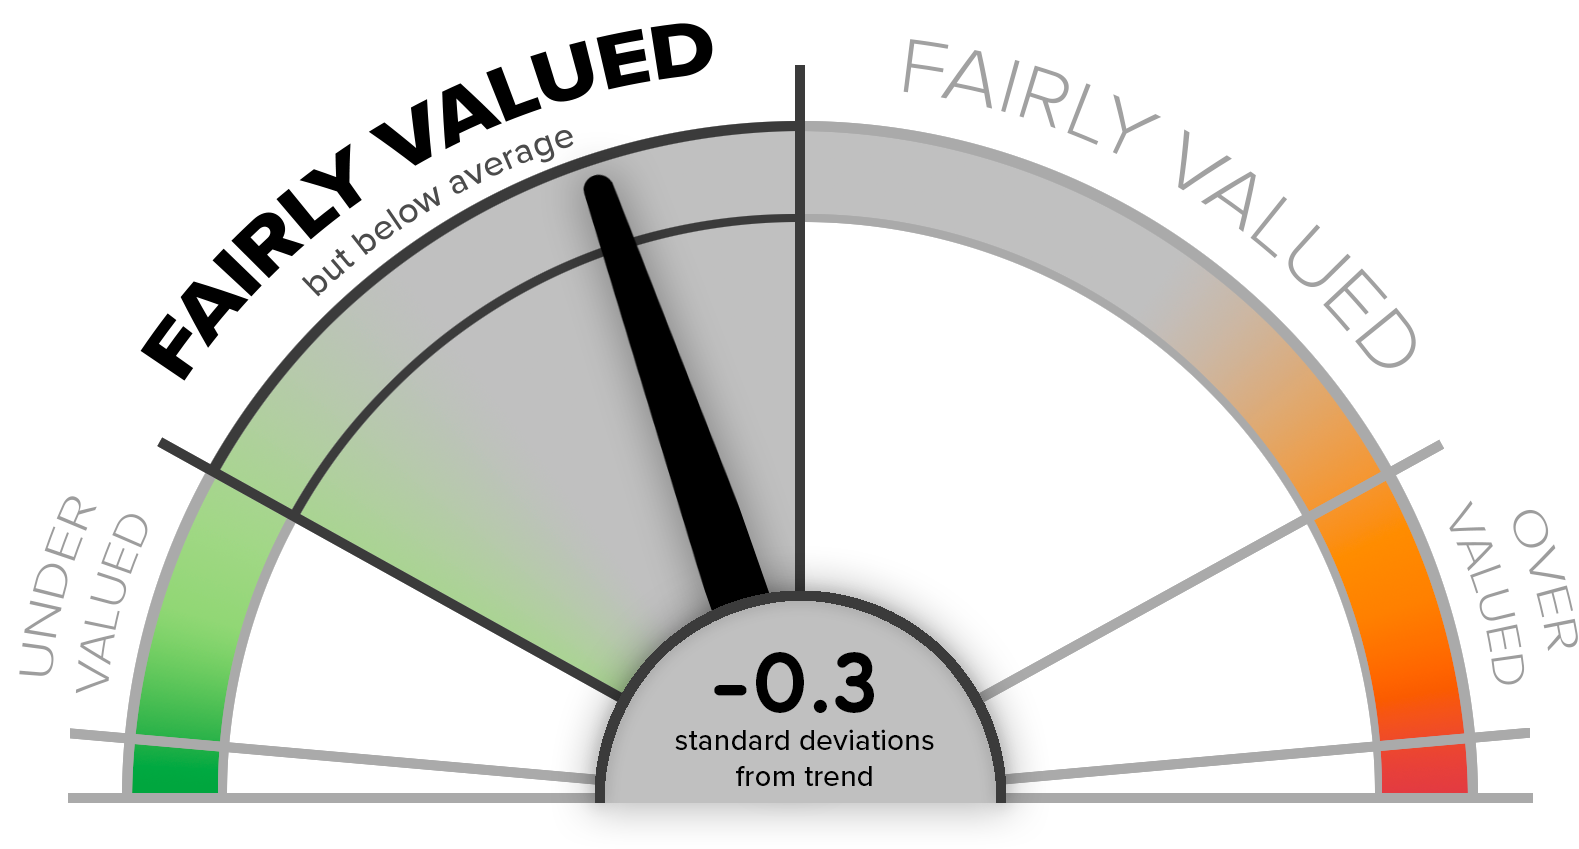
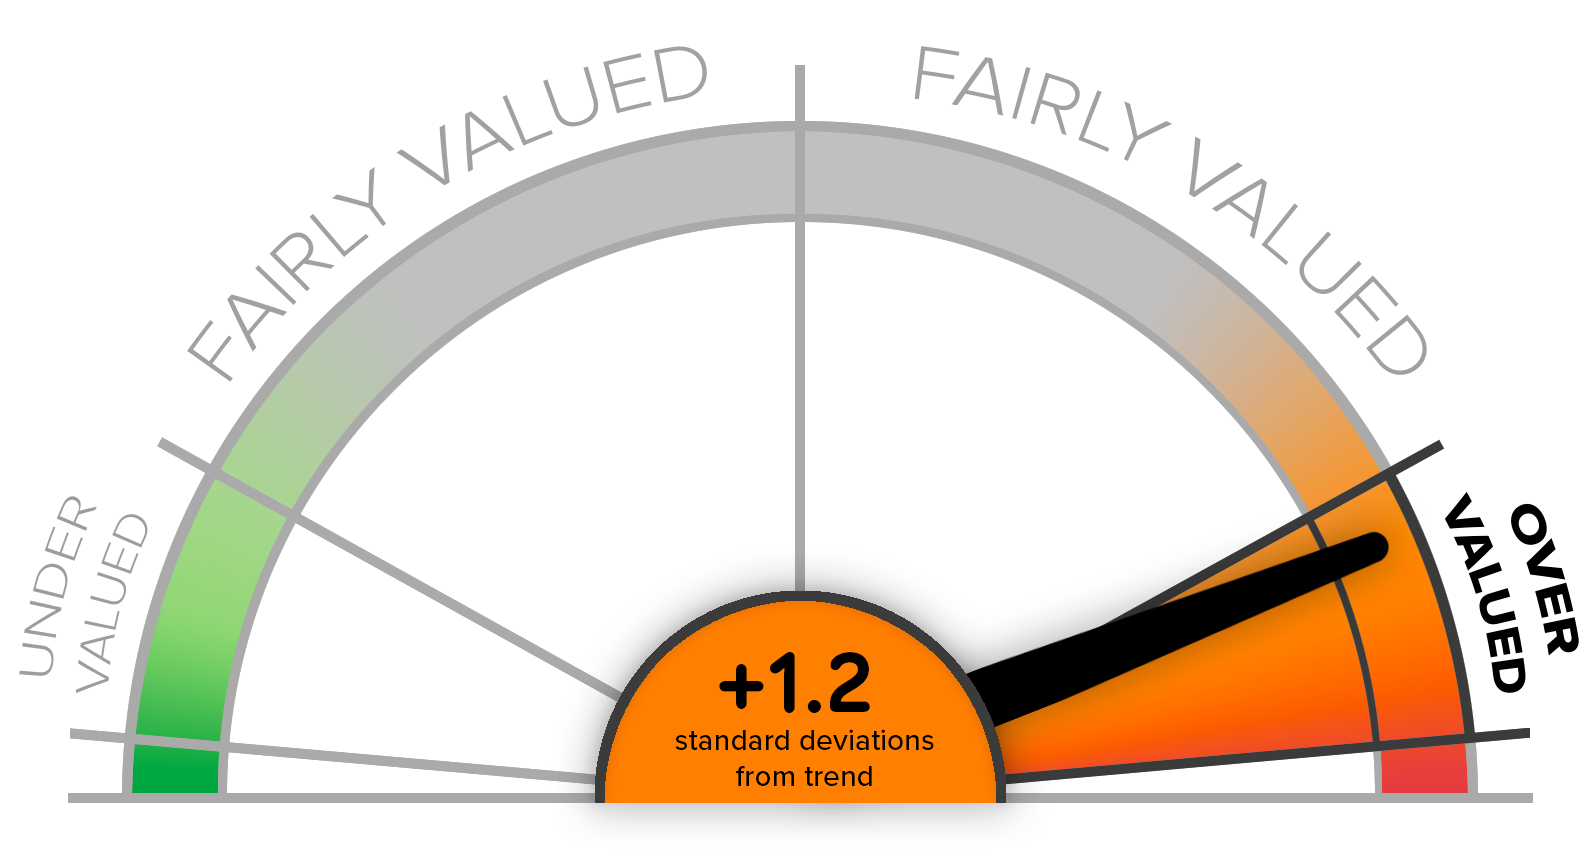
The AMVI is pictured below, only shown through 2017 (members get data through the most recent week). This model is a composite of several of the independent valuation/economic models tracked on the site, and provides a one-stop summary of the aggregate US stock market price relative to historical norms, giving you a good idea of how overheated (or oversold) the market is at any given moment.
The Index correlates well with long-term future stock market performance. Below is a scatterplot showing the AMVI value on the x-axis, and subsequent 5-year S&P500 returns on the y-axis.
This scatterplot shows the index's monthly values plotted against the S&P500's subsequent 5-year returns. The left half of the chart shows all instances where the index ranked market valuation as undervalued. In almost every single instance, subsequent 5-year market returns were positive. In general, youcan see that the further left/undervalued the AMVI score, the higher the subsequent market performance over the next 5 years.
The opposite is also true. Points on the right half of the chart correspond with AMVI values that were historically overvalued (index score > 0), and while very often subsequent 5-year returns were still positive, returns tend to be lower overall than after periods when the market was undervalued.
This relationship is summarized by the light blue regression line. As the index score goes from undervalued to overvalued (left to right on the chart), the subsequent 5-year S&P500 returns tend to fall substantially.
Premium and Data members are able to view the index score, updated weekly, for an up-to-date understanding of the market's current valuation.
Isolating the Extremes
Looking only during periods of model over or under valuation, the trend is even more clear:
This is the same data but with all of the AMVI "Fairly Valued" datapoints removed, retaining only datapoints where the AMVI was more than 1 standard deviation from its historical trend value. There are many fewer datapoints here, but it's visually much easier to see how all the instances of undervalued market ratings (left side) correspond with relatively high returns after 5 years, and all the instances of overvalued market ratings (right side) have much smaller, and often negative, returns after 5 years.
Predictive Value of the Model
Like everything else on this site, this model is not intended to be used for, or capable of, producing significantly above-average investment returns. This model provides a high-level view of overall market valuation. In live portfolios, market peaks and troughs happen much more quickly than these models can predict or update. Also, future market performance may differ very materially from past trends - past performance does not guarantee future results.
Both monthly and annual membership tiers include a 7-day free trial. If you cancel during the 7-day period, you will never be charged.
Data Download Membership
Data Download members get access to everything Premium members do (including all models and the Aggregate Market Value Index, updated weekly). Additionally, this membership tier allows you to download a .xlsx file each month of select CMV models (see Demo file), for personal use in your own investment models. Below is a demo file, filled with dummy data, but in the same format as you'll receive as a member.
Demo Data
Since we cannot refund digital purchases, prior to purchase please download and review the above demo file to ensure that your expectations will be met. This file contains dummy data, but is representative of file you'll receive each month as a member.
Additional Details
Update Frequency
Paying members can access all models, updated weekly. Models with underlying data sources that are updated less frequently than weekly (e.g., GDP data is released quarterly, unemployment data released monthly, etc) will be updated with the most recent data available.
Returns/Refunds
There are no returns/refunds on membership. Premium membership includes a 7-day free trial - if you're unsatisfied in any way, you can cancel your membership in the first 7 days and never be charged. The Data Download membership has no trial, and no returns. Given the one-way nature of downloading the file after purchase, please understand that we cannot offer refunds. Please take a look at the demo file above prior to purchase to ensure that the data & formatting meet your expectations prior to purchase. If you have specific concerns or questions please get in touch prior to purchase at [email protected].
Subscription and Cancellation
Subscriptions are renewed automatically at the end of each period, though you will receive a reminder email prior to renewal to remind you of your subscription and upcoming charge, and giving you time to cancel if you wish to do so. (All payments are made in US dollars.) You can cancel your membership at any time via one-click settings in your account profile. Membership is powered by MemberSpace and they make this process very simple.
Premium & Data Download Membership Terms of Use
- Data cannot be used for commercial purposes.
- Data cannot be resold or broadly redistributed or republished.
- Data is offered for sale and intended to be used for personal, non-commercial purposes - e.g., personal education, personal modeling, etc.
- Do not use data to republish materially similar charts, information, or analysis as can be found on www.currentmarketvaluation.com.
- To the extent the data is used to inform models or images published elsewhere, please attribute the data source as www.currentmarketvaluation.com.
Contact
To make changes to your membership, including cancellation, click the "Your Account" button at the top of the Membership page (visible when you are logged in). For other questions or feedback, contact us at [email protected].